Wed, Oct 16, 2019
Duff & Phelps’ U.S. Normalized Risk-Free Rate Decreased from 3.5% to 3.0% Effective September 30, 2019


Executive Summary
The Equity Risk Premium (ERP) changes over time. Fluctuations in global economic and financial conditions warrant periodic reassessments of the selected ERP and accompanying risk-free rate.
Based on current market conditions, Duff & Phelps is reaffirming its U.S. Equity Risk Premium recommendation of 5.5% to be used in conjunction with a normalized risk-free rate.
However, based on declining real interest rates and long-term growth estimates for the U.S. economy, we are lowering the U.S. normalized risk-free rate from 3.5% to 3.0% when developing discount rates as of September 30, 2019 and thereafter, until further guidance is issued. In summary:
- Equity Risk Premium: Reaffirmed at 5.5%
- Risk-Free Rate: Decreased from 3.5% to 3.0% (normalized)
- Base U.S. Cost of Equity Capital: 8.5% (5.5% + 3.0%)
We will be issuing a more complete Client Alert covering our analysis of the Risk-Free Rate and Equity Risk Premium in mid-October 2019.
Background
The Equity Risk Premium (ERP) is a key input used to calculate the cost of capital within the context of the Capital Asset Pricing Model (CAPM) and other models. Duff & Phelps regularly reviews fluctuations in economic and financial market conditions that warrant a periodic reassessment of the ERP.1
Based on current market conditions, we are reaffirming the recommended U.S. ERP of 5.5%, which was effective for valuations dates as of December 31, 2018 and thereafter. We will maintain our recommendation to use a 5.5% U.S. ERP when developing discount rates until there is evidence indicating equity risk in financial markets has materially changed. We are closely monitoring economic conditions.
The current ERP recommendation (5.5%) was developed in conjunction with a “normalized” 20-year yield on U.S. government bonds as a proxy for the risk-free rate (Rf). Based on recent academic literature and market evidence of a secular decrease in real interest rates (a.k.a. the “rental” rate) and lower long-term real GDP growth estimates for the U.S. economy, we are lowering our recommended normalized risk-free rate from 3.5% to 3.0% for valuation dates as of September 30, 2019 and thereafter.
Methods of Estimating a Normalized Risk-free Rate
Estimating a normalized risk-free rate can be accomplished in a number of ways, including (i) simple averaging, and (ii) various “build-up” methods.2
The first method of estimating a normalized risk-free rate entails calculating averages of yields to maturity on long-term government securities over various periods. This method’s implied assumption is that government bond yields revert to the mean. For example, as of September 20, 2019, the 10-year moving-average for the yield on 20-year U.S. Treasury bonds was 3.0%. In contrast, the corresponding spot yield on September 20, 2019 was 2.0%.
Taking the moving-average over the last 10 years is a simple way of “normalizing” the risk-free rate. An issue with using historical averages, though, is selecting an appropriate comparison period that can be used as a reasonable proxy for the future.
The second method of estimating a normalized risk-free rate entails using a simple build-up method, where the components of the risk-free rate are estimated and then added together. Conceptually, the risk-free rate can be (loosely) illustrated as the sum of the following two components:3

In Exhibit 1, we summarize long-term real rate estimates and inflation expectations for the United States through mid-September 2019, based on data assembled from a variety of sources. We also display the spot 20-year U.S. Treasury yield and its long-term (10-year) trailing average as of September 20, 2019.
Exhibit 1: Long–Term Spot and Normalized Risk–Free Rates for the United States September 2019 (approximately):4, 5, 6
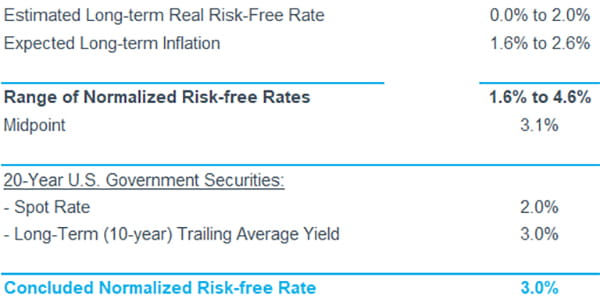
Academic research in the area of real rates has been very active recently. We rely on estimates from these different academic studies to infer our estimated long-term real risk-free rate range of 0.0% - 2.0%. Academic researchers and economic analysts have proposed a number of explanations for the secular (i.e., not cyclical or temporary) decline in global real interest rates, which they argue precedes the onset of the 2008 global financial crisis. The following are some of the most-often-cited factors:7
- Lower global long-run output and productivity growth
- Shifting demographics (aging population leading to slower labor force expansion)
- Global “savings glut”
- Safe asset shortage (increased demand for safe-haven assets, accompanied by a declining supply)
With regards to long-term inflation expectations, the same declining trend has been taking hold in the United States and across several other developed markets over the last few years. Inflation has been persistently below the 2.0% target set by major central banks, such as the Federal Reserve Bank (Fed), the European Central Bank, the Bank of England, and the Bank of Japan.
Can the Normalized Risk-free Rate Decline While the Spot Yield is Increasing?
A long-term “normalized” risk-free rate attempts to capture the sustainable average return of long-term bonds issued by a government considered “safe” or free of default risk (e.g., U.S. Treasuries).8,9 However, the use of a normalized risk-free rate during certain periods does not assume that “spot” rates will not fluctuate during these periods. Spot rates will almost undoubtedly fluctuate during the current period as well, just as they have fluctuated in all previous periods of normalization. This fluctuation in itself does not alter our recommendation based on economic fundamentals.
Duff & Phelps will continue to monitor risk-free rates and other cost of capital inputs very closely. If and when (i) long-term spot yields increase to a level that approaches the Duff & Phelps recommended U.S. normalized risk-free rate (e.g. differences are lower than 50 b.p.), and (ii) there is evidence that this increase in spot yields is not transitory, we will then consider recommending a return to using the spot rate as the basis for the risk-free rate.
Duff & Phelps’ U.S. Equity Risk Premium Recommendation and “Base” Cost of Equity
Duff & Phelps last changed its U.S. ERP recommendation on December 31, 2018. On that date, our ERP recommendation was increased to 5.5% (from 5.0%) in response to evidence that suggested a heightened level of risk in financial markets.
Duff & Phelps monitors various economic and financial market indicators, as well as two quantitative models as corroboration to arrive at its U.S. ERP recommendation. While current evidence seems to be pointing to a decline in equity risk in financial markets relative to December 31, 2018, from a qualitative perspective we deem it prudent to adopt a “wait and see” approach, especially with mounting indications of deteriorating global economic growth prospects and a rise in global trade uncertainty.
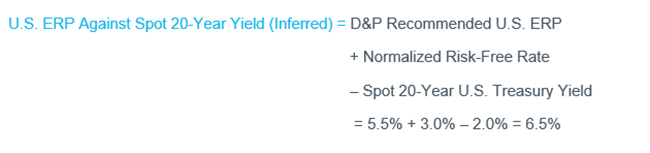
Accordingly, Duff & Phelps is reaffirming the recommended U.S. ERP of 5.5%, to be used in conjunction with a normalized risk-free rate of 3.0%, when developing discount rates as of September 30, 2019 and thereafter. The combination of the new normalized risk-free rate (3.0%) and the reaffirmed U.S. recommended ERP (5.5%) result in an implied U.S. “base” cost of equity capital estimate of 8.5% (3.0% + 5.5%). Were we to use the spot yield-to-maturity on 20-year U.S. Treasuries of 2.0% as of September 20, 2019, one would have to increase the ERP assumption accordingly. One can determine the ERP against the spot 20-year yield as of September 20, 2019, inferred by Duff & Phelps’ recommended U.S. ERP (used in conjunction with the normalized risk-free rate), by using the following formula:
Sources
1. For a discussion of some of the studies and factors we evaluate, refer to Chapter 3 of the Duff & Phelps Cost of Capital Navigator “Resources” Section or to Duff & Phelps’ Client Alert entitled “Duff & Phelps Increased U.S. Equity Risk Premium Recommendation to 5.5%, Effective December 31, 2018”. To obtain a free copy of this Client Alert, visit www.duffandphelps.com/costofcapital.
2. For a more detailed discussion on reasons for normalization and methods that can be used to normalize risk-free rates, refer to Chapter 3 in the Duff & Phelps Cost of Capital Navigator “Resources” section.
3. This is a simplified version of the “Fisher equation”, named after Irving Fisher. Fisher’s “The Theory of Interest” was first published by Macmillan (New York), in 1930.
4. Pescatori, Andrea, and Mr Jarkko Turunen. Lower for longer: neutral rates in the United States. No. 15-135. International Monetary Fund, 2015.; Kiley, Michael T., “What Can the Data Tell Us About the Equilibrium Real Interest Rate?”, Finance and Economics Discussion Series 2015–077. Washington: Board of Governors of the Federal Reserve System (August 2015); Lubik, Thomas A. and Christian Matthes “Calculating the Natural Rate of Interest: A Comparison of Two Alternative Approaches”, Richmond Fed Economic Brief (October 2015); Johannsen, Benjamin K. and Elmar Mertens (2016), "The Expected Real Interest Rate in the Long Run: Time Series Evidence with the Effective Lower Bound”, FEDS Notes, Washington: Board of Governors of the Federal Reserve System, February 9, 2016; Laubach, Thomas, and John C. Williams. "Measuring the natural rate of interest redux." Business Economics 51, no. 2 (2016): 57-67; Taylor, John B., and Volker Wieland. "Finding the equilibrium real interest rate in a fog of policy deviations." Business Economics 51, no. 3 (2016): 147-154.; Lansing, Kevin J., “Projecting the Long-Run Natural Rate of Interest”, FRBSF Economic Letter 2016–25 (August 2016); Hamilton, James, Ethan Harris, Jan Hatzius, and Kenneth West, “The Equilibrium Real Funds Rate: Past, Present and Future”, IMF Economic Review, November 2016, Vol. 64, Issue 4, p. 660–707; Holston, Holston, Kathryn, Thomas Laubach, and John C. Williams. "Measuring the natural rate of interest: International trends and determinants." Journal of International Economics 108 (2017): S59-S75; Del Negro, Marco and Giannone, Domenico and Giannoni, Marc P. and Tambalotti, Andrea (2017-05-11), “Safety, Liquidity, and the Natural Rate of Interest”, FRB of NY Staff Report No. 812; Sichel, Daniel E. & Wang, J. Christina (2017), “The equilibrium real policy rate through the lens of standard growth models”, Current Policy Perspectives 17-6, Federal Reserve Bank of Boston; Lunsford, Kurt G., and Kenneth D. West. “Some evidence on secular drivers of US safe real rates” No. w25288. National Bureau of Economic Research, 2018.; Wieland, V. (2018). Chapter 2 The Natural Rate - Section One - R- Star: The Natural Rate and Its Role in Monetary Policy; In the Structural Foundations of Monetary Policy (pp. 45-61). Hoover Institution Press, Stanford University; Viktors Ajevskis, (2018). "The Natural Rate of Interest: Information Derived from a Shadow Rate Model," Working Papers 2018/02, Latvijas Banka; Fiorentini, Gabriele, Galesi, Alessandro, Perez-Quirós, Gabriel and Sentana, Enrique, (2018), "The rise and fall of the natural interest rate," No 1822, Working Papers, Banco de España; Christensen, Jens HE, and Glenn D. Rudebusch. "A new normal for interest rates? Evidence from inflation-indexed debt." Review of Economics and Statistics (2017): 1- 46; Lewis, Kurt F., and Francisco Vazquez-Grande (2017). “Measuring the Natural Rate of Interest: Alternative Specifications," Finance and Economics Discussion Series 2017-059. Washington: Board of Governors of the Federal Reserve System; R.C.M. Beyer, V. Wieland/Journal of International Money and Finance 94 (2019) 1–14
5. We continue to also rely on the results of Haubrich et al (2012), Lubick and Matthes (2015), Laubach and Williams (2016), and Holston et al. (2017) work, which are updated on a regular basis and published in the Federal Reserve Bank of Cleveland’s website, the Federal Reserve Bank of Richmond website, and the Federal Reserve Bank of New York’s website, respectively.
6. “The Livingston Survey: June 2019,” Federal Reserve Bank of Philadelphia (June 7, 2019); “Survey of Professional Forecasters: Third Quarter 2019,” Federal Reserve Bank of Philadelphia (August 2019); Blue Chip Financial Forecasts (June 1, 2019 and September 1, 2019); Blue Chip Economic Indicators (March 2019 and August 2019); “Consensus Forecasts – A Digest of International Economic Forecasts”, Consensus Economics Inc. (April 2019 and August 2019); Federal Reserve Bank of Cleveland (estimates as of August 2019); Philadelphia Federal Reserve, Aruoba Term Structure of Inflation Expectations (estimates as of August 2019); the University of Michigan Inflation Expectations, September 2019.
7. For a more detailed discussion of some of these and other factors, see, for example, Rachel, Lukasz and Thomas D Smith “Secular drivers of the global real interest rate”, Bank of England Staff Working Paper No. 571, December 2015. Also, consider reviewing Chapter 3 in the Duff & Phelps Cost of Capital Navigator “Resources” section
8. Beginning with the financial crisis of 2008 (the “Financial Crisis”), analysts have had to reexamine whether the “spot” rate is still a reliable building block upon which to base their cost of equity capital estimates. The Financial Crisis challenged long-accepted practices and highlighted potential problems of simply continuing to use the spot yield-to-maturity on a safe government security as the risk-free rate, together with historical equity risk premiums, without any further adjustments.
9. The general framework for the normalization argument could be described as follows: (i) the extremely-low rates we have experienced in recent years would not exist without the market intervention by “non-market” participants (i.e., central banks) pushing rates down “artificially”, (ii) these abnormally-low rates are not sustainable in the long-term, and (iii) rates tend to revert to a mean that reflects the long-term relationship between nominal and real interest rates.
Valuation Advisory Services
Our valuation experts provide valuation services for financial reporting, tax, investment and risk management purposes.
Business Valuation Services
Kroll is the largest independent provider of business valuation services.
Valuation Services
When companies require an objective and independent assessment of value, they look to Kroll.
